
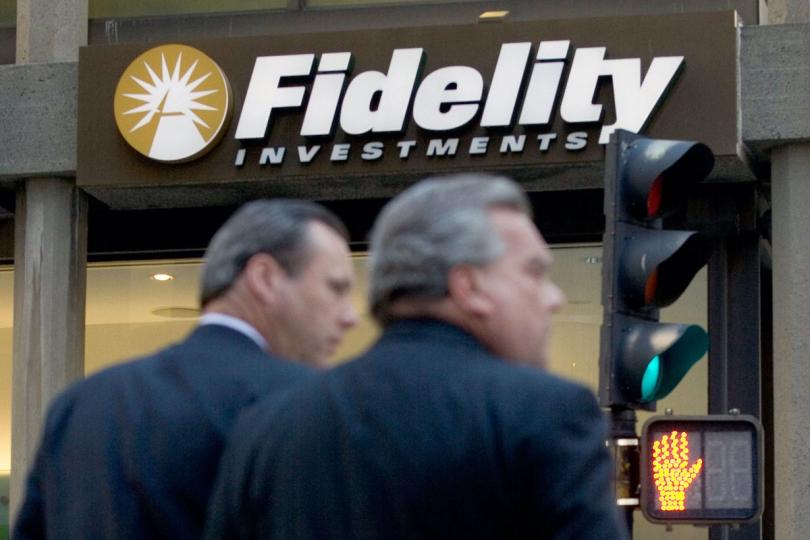

Bitcoin traders received two constructive signals before the new week: U.S.-listed spot bitcoin ETFs took in $221.7 million on Thursday, their largest daily intake in two months, and CoinDesk reported that the move ended a 10-day outflow streak. Fidelity’s FBTC led the inflows, while BlackRock’s IBIT still saw an outflow, which matters because a broad recovery in ETF demand is stronger than a single-fund rebound.
The second signal came from derivatives. CoinDesk reported that ether, solana and bitcoin rallied as bearish traders were forced to close positions, with $281 million in short liquidations over 24 hours versus $159 million in long liquidations. Ether accounted for the largest share of wiped-out bearish positions, while bitcoin pushed toward its strongest level in roughly two weeks.
For active traders, the important distinction is between a relief rally and durable demand. ETF inflows can support spot demand, but one positive day does not erase the earlier 10-day outflow streak or the roughly $5.4 billion year-to-date net outflow cited in the report. A short squeeze can also lift prices quickly because short sellers buy back exposure, but that buying may fade once forced covering is complete.
A practical read is to watch three things together: whether ETF inflows repeat for several sessions, whether funding rates become overheated after the squeeze, and whether BTC holds above recent rebound levels without depending on forced liquidations. If spot ETF demand improves while perpetual funding stays moderate, the rally has a better foundation. If price rises while funding spikes and ETF flows turn negative again, the setup is more fragile.
This is not a reason to chase. It is a reason to tighten the dashboard. ETF flows show whether cash-market investors are returning; liquidation data shows whether leverage has been flushed; BTC, ETH and SOL relative strength shows whether risk appetite is narrow or broad. The better trade plan is built around invalidation levels, position size and liquidity, not a headline alone.
Risk notice: Crypto assets and crypto derivatives are volatile and can lose value quickly. ETF flow data, liquidation data and market commentary are not investment advice. Always verify data from primary sources and use risk controls before trading.
Sources: CoinDesk on U.S. spot bitcoin ETF inflows; CoinDesk on ETH, SOL and BTC short squeeze; Coinglass liquidation dashboard; SoSoValue U.S. bitcoin spot ETF data.
原创文章,作者:financial transaction,如若转载,请注明出处:https://www.fanbi.net/archives/903

