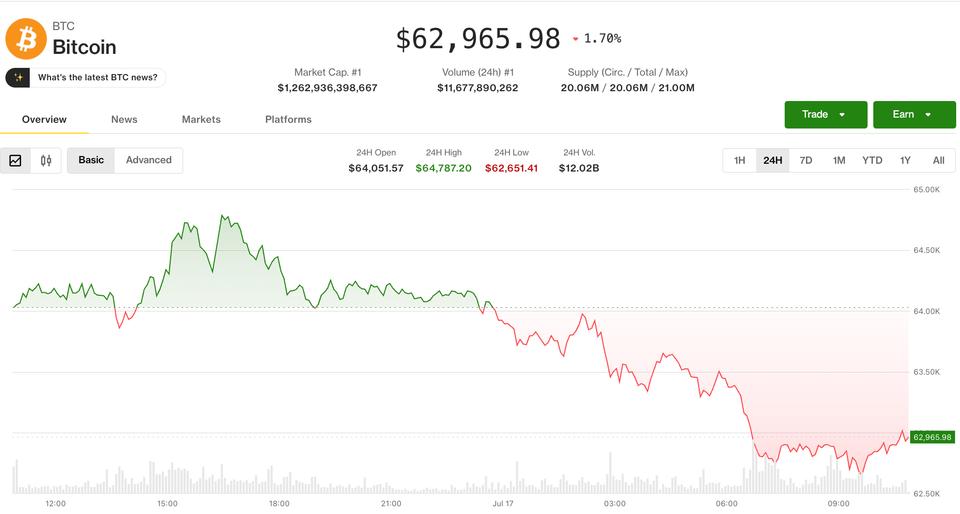
Bitcoin and major crypto assets are still trading in a market where macro headlines, ETF flows and derivatives positioning can move together. CoinDesk’s latest live-markets coverage described July ETF flows as choppy, while CoinGlass showed a large 24-hour liquidation count and roughly hundreds of millions of dollars in forced closes across crypto derivatives. That combination matters because price can look calm until crowded leverage starts to unwind.
The important point for traders is that liquidation data is not a forecast. A liquidation cluster can show where leveraged longs or shorts may be vulnerable, but it does not guarantee that price will travel there. Funding rates, open interest and recent volume need to be read together. If open interest is rising while price stalls, a breakout can become fragile because too many traders are using the same level for leverage.
A practical workflow is to mark the recent high and low, check whether funding is extreme, then reduce position size when liquidation heatmaps are concentrated near the entry. Traders who use perpetual swaps should also compare the funding cost with their expected holding time. A setup that looks attractive on a chart can become poor if the trade needs several funding windows to work.
The cautious view is simple: use liquidation dashboards as a risk map, not as a signal service. Forced selling and forced buying can speed up a move, but they do not replace trend, liquidity and stop placement.
Sources: CoinDesk live markets; CoinGlass liquidations; CoinGlass funding rates.
Risk notice: Crypto derivatives can produce rapid losses, especially with leverage. This article is educational information, not investment advice.
原创文章,作者:financial transaction,如若转载,请注明出处:https://www.fanbi.net/archives/3841